Developing an Experimental Project:
|
In a scientific investigation, the data collected should be handled with increasing sophistication as the researcher matures. With essentially the same procedure, we will show data collection and analysis at an Intermediate (Grades 6 & 7) and Senior level (Grades 10-12).
Procedure – Dough Preparation
- Make the bread using the following ingredient amounts
- 475 ml warm water (110 degrees F/45 degrees C)
- 135 g white sugar
- 20 g active dry yeast
- 9 g salt
- 60 ml vegetable oil
- 820 g bread flour
- Follow the directions for making the dough at
http://allrecipes.com/recipe/amish-white-bread/detail.aspx
(or use the local link – Amish Bread Recipe – if the above URL does not work) - Begin kneading the dough. Remove an approximately 100 g portion after 2 minutes of kneading. Shape into a ball, contacting the dough as little as possible. Place on an oiled cookie sheet.
- Repeat step 3 every 2 minutes until 7 or 8 dough balls are formed.
- Cut any leftover dough into approximately 100 g portions. Shape into balls on a second oiled cookie sheet. Use this dough as a control to ensure rising and oven baking conditions are consistent in the oven.
- Let the dough rise uncovered for 60 minutes in an oven preheated to 170oF (77oC). Oven was turned off with 37 minutes of rising time remaining.
- Remove dough from oven and preheat oven to 350oF. Bake for 20 minutes. Put the tray with the variable knead times on the top rack and the control buns on the middle rack. Remove from oven and allow to cool before touching the buns.
- Weigh each bun, then wrap in cling film. Submerge each bun in water to measure the volume of water displaced.
- Replace the flour in step 1 with whole wheat. Continue with steps 2 – 8
- Repeat steps 1-9 twice, for a total of three trials with white flour and three trials with whole wheat.
On the second and third trials of the white flour dough, make buns every minute for the first 4 minutes. Continue kneading and making buns every 2 minutes until all the dough is used (approximately 26 minutes).On the second and third trials of the whole wheat dough, continue kneading and making buns every 2 minutes until all the dough is used (approximately 26 minutes). This will allow more data points at the beginning of the experiment (for the white flour) and at the end (for the whole wheat flour).
More Advanced level:
Observations of white dough buns (Intermediate Level)
Table 1. Observations of the control white dough buns. Each bun was kneaded for 16 minutes. Buns rose and were baked in the following positions on the middle rack.
| Oven location | Mass (+ 0.1 g) | Volume (+ 10 mL) | Density (g/mL) |
| Back left | 82.2 | 240 | 0.343 |
| Back right | 72.2 | 210 | 0.344 |
| Front left | 75.6 | 220 | 0.344 |
| Front right | 67.1 | 200 | 0.336 |
Table 2. Observations of white dough buns, each bun was kneaded for different amounts of time.
| Knead time of bun | Mass (+ 0.1 g) | Volume (+ 10 mL) | Density (g/mL) |
| 2 minutes | 88.9 | 195 | 0.456 |
| 4 minutes | 105.4 | 265 | 0.398 |
| 6 minutes | 106.7 | 280 | 0.381 |
| 8 minutes | 99.0 | 260 | 0.381 |
| 10 minutes | 91.1 | 250 | 0.364 |
| 12 minutes | 104.6 | 280 | 0.374 |
| 14 minutes | 105.2 | 295 | 0.357 |
| 16 minutes | 93.7 | 275 | 0.341 |
| 18 minutes | 94.8 | 270 | 0.351 |
Analysis and Interpretation of Data (at an Intermediate Level)
The control buns had an average density of 0.342 g/mL, all the control buns were within 1.7% of the average value. This suggests that the location of the buns in the oven during rising and baking has a negligible impact on the final density.
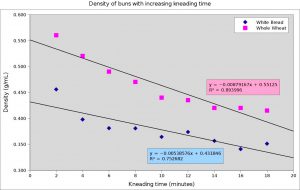
Figure 1. The densities of white flour and whole wheat buns with increased kneading time.
From figure 1, it can be seen that the density of both white flour buns and whole wheat buns decreases as the length of kneading increases. The whole wheat buns are more dense than the white buns. The slope of the line for the whole wheat buns is steeper than the white flour buns. The steeper line suggests that the density is decreasing more quickly in the whole wheat buns. This is odd because gluten, a protein found in wheat, develops more slowly in whole wheat flour than in white flour. The trend line for the whole wheat dough should be less steep than for the white flour.
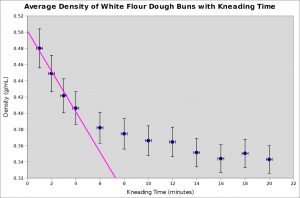
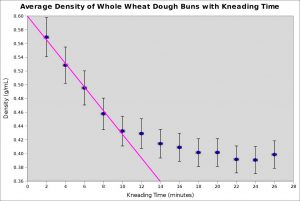
How long must the bread be kneaded? While kneading the bread does decrease the density, kneading the bread for a long time is hard work. With the white flour, the densities at 6 minutes and 8 minutes were the same. This suggests that kneading the white flour dough for 8 minutes does not cause much more gluten to develop than kneading it for 6 minutes. In the whole wheat dough, the same density was found at 14 and 16 minutes. Again, this suggests that 16 minutes of kneading the whole wheat flour is enough to see most of the gluten react.
Conclusion
White flour dough should be kneaded for 6 to 8 minutes, while whole wheat flour dough should be kneaded for 14 to 16 minutes. While some further decreases in density could be observed after this, these times provide a good compromise between effort and lightness of the bread.
Analysis and Interpretation of Data (at a Senior Level)
The control buns had an average density of 0.342 g/mL, all the control buns were within 1.7% of the average value. This suggests that the location of the buns in the oven during rising and baking has a negligible impact on the final density.
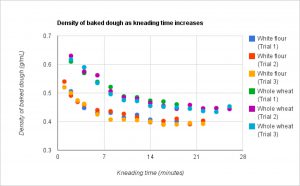
Figure 2. Plot of all the densities determined for three trials of white flour buns and three trials of whole wheat buns.


